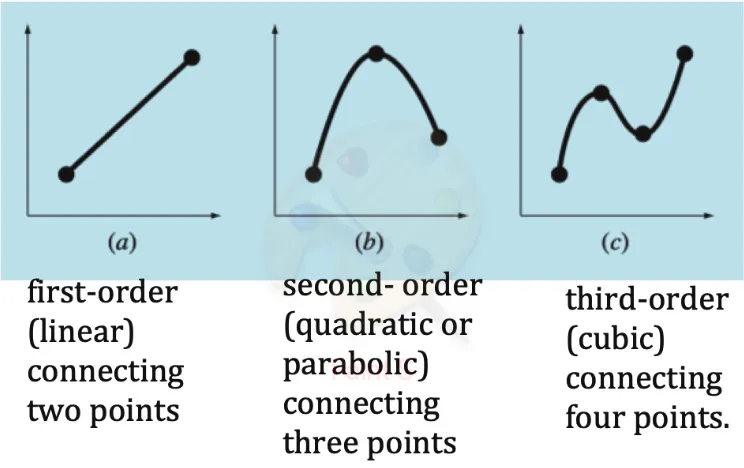
Interpolation
What is Interpolation?
Section titled “What is Interpolation?”Interpolation is a method of estimating unknown data points that lie between known data points. Think of it as “connecting the dots” with a mathematical function.
Key Points:
- Constructs new data points based on a discrete set of known data points
- Creates a function that passes through ALL given data points exactly
- Used to estimate values between the given data points
Important Theorem
Section titled “Important Theorem”Weierstrass Approximation Theorem: For any continuous function on a closed interval, there exists a polynomial that can approximate it as closely as desired.
Key Result: For
Newton’s Divided-Difference Method
Section titled “Newton’s Divided-Difference Method”The Newton Form
Section titled “The Newton Form”For
Finding the Coefficients
Section titled “Finding the Coefficients”Step 1: Set
Step 2: Set
Step 3: Set
Divided Difference Notation
Section titled “Divided Difference Notation”Zeroth divided difference:
First divided difference:
Second divided difference:
General
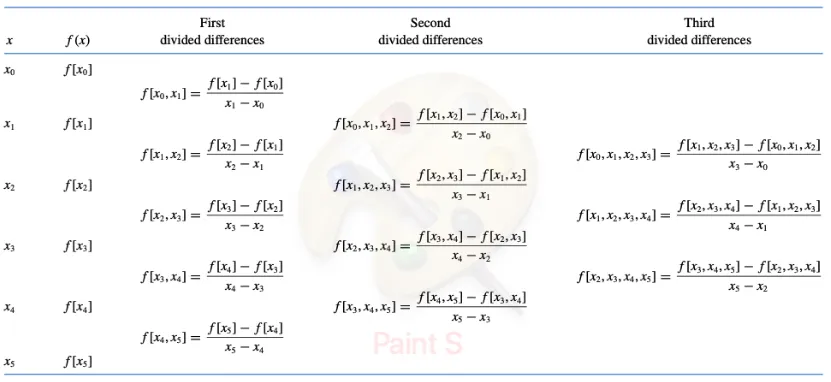
Newton’s Divided Difference Formula
Section titled “Newton’s Divided Difference Formula”The coefficients are:
Final Newton Form:
4.1.2 Lagrange Interpolating Polynomials
Section titled “4.1.2 Lagrange Interpolating Polynomials”The Lagrange Form
Section titled “The Lagrange Form”The same interpolating polynomial can be written as:
where the Lagrange basis polynomials are:
Examples of Lagrange Polynomials
Section titled “Examples of Lagrange Polynomials”For
For
Example: Current in Wire
Section titled “Example: Current in Wire”Given data:
| t | 0 | 0.1250 | 0.2500 | 0.3750 | 0.5000 |
|---|---|---|---|---|---|
| i | 0 | 6.24 | 7.75 | 4.85 | 0.0000 |
Problem: Find
Errors in Interpolating Polynomials
Section titled “Errors in Interpolating Polynomials”Error Formula
Section titled “Error Formula”For a function
where
Error Estimation
Section titled “Error Estimation”Theoretical error:
Practical error estimation (using additional data point):
Least Squares Approximation
Section titled “Least Squares Approximation”When to Use Least Squares
Section titled “When to Use Least Squares”Unlike interpolation (which passes through all points exactly), least squares finds the “best fit” curve that minimizes the overall error when:
- Data contains measurement errors
- We want a simpler model than exact interpolation
- We have more data points than we want polynomial degree
The Least Squares Principle
Section titled “The Least Squares Principle”Residual (error):
Objective: Minimize the sum of squared errors:
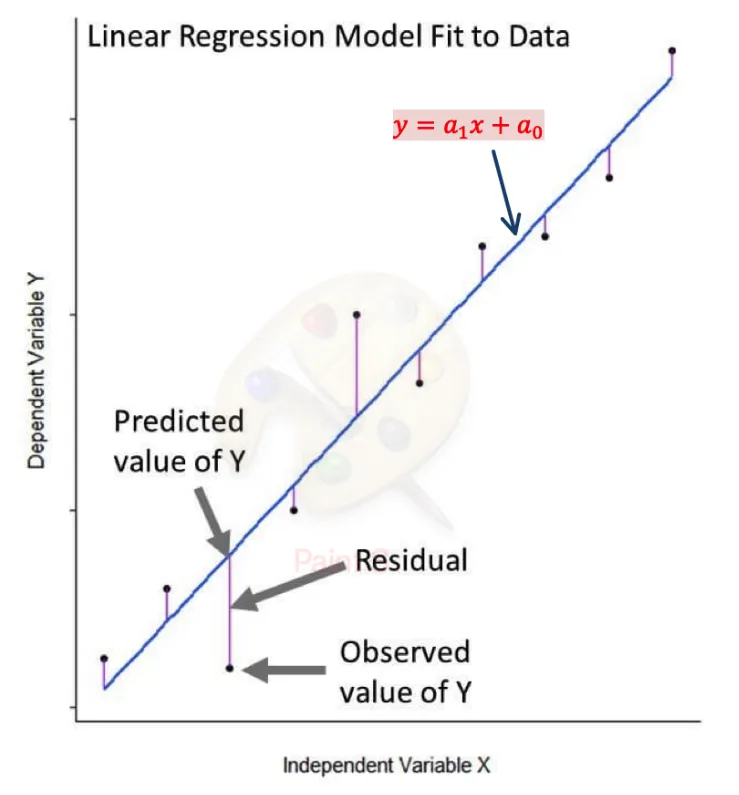
Linear Regression
Section titled “Linear Regression”The Linear Model
Section titled “The Linear Model”Find the best line:
Sum of squared errors:
Finding the Coefficients
Section titled “Finding the Coefficients”To minimize
This gives us the normal equations:
Example: River Flow Prediction
Section titled “Example: River Flow Prediction”Given data:
| Precipitation (cm) | 88.9 | 108.5 | 104.1 | 139.7 | 127.0 | 94.0 | 116.8 | 99.1 |
|---|---|---|---|---|---|---|---|---|
| Flow (m³/s) | 14.6 | 16.7 | 15.3 | 23.2 | 19.5 | 16.1 | 18.1 | 16.6 |
Problem: Predict annual water flow for 120 cm precipitation.
Polynomial Regression
Section titled “Polynomial Regression”When Linear Isn’t Enough
Section titled “When Linear Isn’t Enough”Sometimes data follows a curved pattern that a straight line can’t capture well.
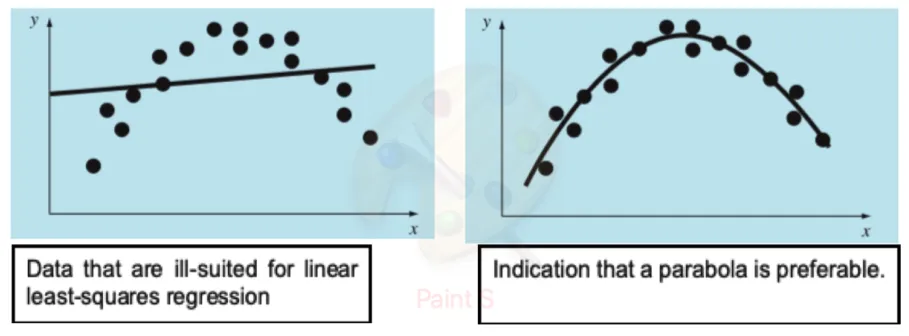
The Polynomial Model
Section titled “The Polynomial Model”Fit a polynomial of degree
General Method
Section titled “General Method”Minimize:
Normal equations: For
This creates a system of
Example: Population Growth
Section titled “Example: Population Growth”Given data:
| t (years) | 0 | 5 | 10 | 15 | 20 |
|---|---|---|---|---|---|
| p (population) | 100 | 200 | 450 | 950 | 2000 |
Problem: Use 3rd-order polynomial regression to predict population at
Summary
Section titled “Summary”Key Differences
Section titled “Key Differences”| Method | Purpose | Passes Through Points? | Best For |
|---|---|---|---|
| Interpolation | Exact fit | Yes, all points | Clean data, need exact values |
| Least Squares | Best approximation | No, minimizes error | Noisy data, want simple model |
When to Use Each Method
Section titled “When to Use Each Method”Use Interpolation when:
- Data is precise and error-free
- You need exact values at given points
- You want to estimate between known points
Use Least Squares when:
- Data contains measurement errors
- You want a simpler model than exact interpolation
- You have more data points than desired polynomial degree
- You want to predict trends and patterns